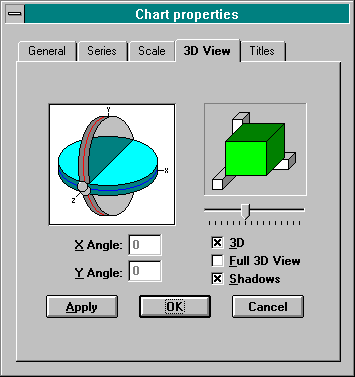
For help accessing the 3D View Tab, see How to Set Graph Properties.
The 3D View Tab of the Chart Properties dialog box lets you set 3D and rotation effects for a three-dimensional graph. To make your graph three-dimensional, check the 3D options box. To return to a two-dimensional graph, “uncheck” this box.

To rotate the graph:
-
Access the 3D View Tab.
-
Check the Full 3D View box.
-
Drag the marbles to desired angles in the picture of two intersecting planes, or write the desired angles in the fields. (The “X Angle” box controls the red marble on the plane labeled “Y”. The “Y Angle” box controls the blue marble on the plane labeled “X”.)
-
Verify the desired view shown in the sample rotation frame to the right of the picture.
-
Click on the OK button.
To turn off rotation:
-
Access the 3D View Tab.
-
“Uncheck” the Full 3D View box.
-
Click on the OK button.
Controlling the 3D Depth
You can also control the Depth of the 3D graph with the sliding control located underneath the sample rotation frame. When you drag the sliding control to the right, you increase the depth (in comparison to the graph width). Sliding to the left decreases the graph depth. Verify the desired depth shown in the sample rotation frame.
3D Shadows
The Shadows check box allows you to turn on or off the shadow for the data marks in 3D mode. Turning the shadow off causes the back of data marks to paint in the same color assigned to the front of the marks. The default setting is “on”.
Apply your changes without leaving the tab by pressing the Apply button. To apply your changes and return to the graph, press the OK button. To cancel changes made on this tab and return to the graph, press the Cancel button; changes already applied on other tabs will not be cancelled.