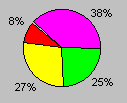
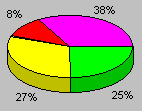
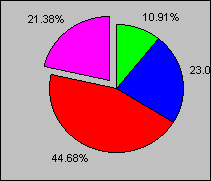
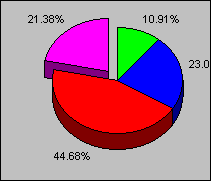
This type of graph shows the relationship or proportions of parts to a whole. It is therefore useful for showing, as pieces of the pie, the proportion of pension liability that is due to retirement, termination, and other decrements. This graph has several variations, including:
| 2D | 3D | |
| Standard Pie: as shown. |  |
 |
| Exploding Pie: You can drag one or more slices a desired distance. |  |
 |
Only the X-axis can be rotated in this type of graph.