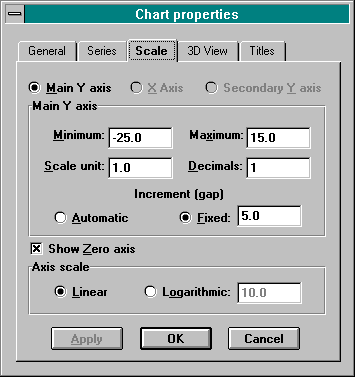
For help accessing the Scale Tab, see How to Set Graph Properties.
The Scale Tab of the Chart Properties dialog box lets you set the scale for (most commonly) the Y-axis.

Axis section:
Axis selection: Check the appropriate axis to customize, usually the main Y-axis. The X-axis is available only for scatter graphs. (The secondary Y-axis is never available.)
Minimum and Maximum: ProGraph will set the maximum value at a number at least as large as the greatest value of any data in the series. ProGraph will also set the minimum value at zero, unless your data contains negative values. In the latter situation, ProGraph chooses a minimum value that is negative and at least as small as the smallest value of any data in the series. The maximum and minimum values will always be a multiple of the gap (see below) on the axis.
Alternatively, you may set the desired minimum and maximum values for the axis selected. If the absolute value of a data mark to be plotted is greater than the absolute value of the selected maximum or minimum, then the graph will be clipped.
Scale Unit: ProGraph automatically sets the scale unit for any axis at 1 and shows a fixed increment gap (see below). Alternatively, you may specify a scale unit, in which case ProGraph will divide minimum and maximum values and the (fixed increment) gap by the scale unit. As the maximum value is thereby increased, a scale unit less than one would be used mainly for displaying large numbers.
If the gap is to be recalculated automatically, then also click the Automatic Increment radio button (see below), and ProGraph will then notch the axis such that the gap is recalculated as: maximum value divided by scale unit, divided by 10. For example, if “Minimum” is zero, “Maximum” is 30,000,000 and “Scale unit” is 1, then ProGraph will notch the axis at 3,000,000, at 6,000,000, at 9,000,000 and so forth, up to 30,000,000. If “Scale unit” is .5 instead, then ProGraph will notch at 6,000,000, at 12,000,000 and so forth, up to 60,000,000. If “Scale unit” is 2 instead, then ProGraph will notch at 1,500,000, at 3,000,000 and so forth, up to 15,000,000. As for a fixed increment gap, the maximum and minimum values are adjusted to equal the specified maximum and minimum values divided by the scale unit.
Decimals: Specify the number of decimals to display. The default setting is zero (no decimals). Usually you would display decimals only if the numbers plotted are small. For example, setting “Decimals” to 2 would result in numbers to two decimal places, rather than whole numbers, displayed along the axis being scaled. If the values of data are small enough, ProGraph will automatically set “Decimals” to be greater than zero.
Automatic or Fixed Increment (gap): ProGraph automatically selects, according to the values of graphed data, the gap between notches on the axis, which gap appears in the box for the “Fixed” option. However, you can specify a desired increment. For example, if you have a maximum of 100 for the axis and want ProGraph to notch the axis at every 20, type “20” in the Fixed option box. Alternatively, to have ProGraph recalculate the gap, as, for example, if you are resetting the scale unit (at a number other than 1), click the “Automatic” option radio button. (Even if the scale unit is not reset, i.e., it is left as 1, selecting the Automatic option will result in recalculation of the gap.)
Other:
Show Zero axis: When this box is checked and the graph has negative values, the line representing zero will be shown and the data marks will go up and down, depending upon whether they are positive or negative numbers. To “erase” that line, click on this box (which removes the check mark).
Linear or Logarithmic Axis scale: The default setting is a linear scale, but you can choose a logarithmic scale. When you select a log scale, you can also type the base used. The default log base is base 10.
Apply your changes without leaving the tab by pressing the Apply button. To apply your changes and return to the graph, press the OK button. To cancel changes made on this tab and return to the graph, press the Cancel button; changes already applied on other tabs will not be cancelled.