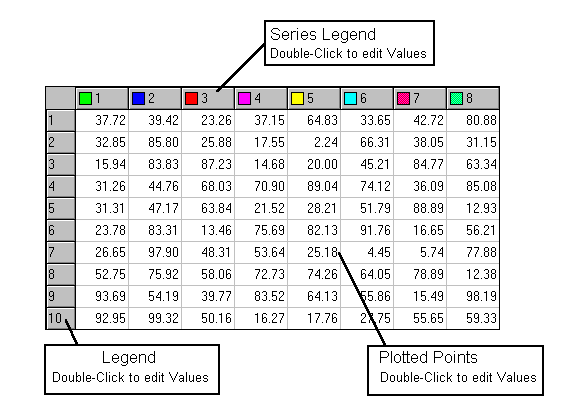
For help accessing the data editor, see How to Edit Graphed Data.

The Data Editor allows you to alter the values plotted in the graph and to change the legend (X-axis) and series legend (data series) labels.
EDITING VALUES:
-
To edit any of the cells containing a value, double-click the left mouse button over the value. This will permit you to edit the selected value.
-
You can move up and down, or right and left, by using the arrow keys on the keyboard.
EDITING LEGEND AND SERIES LEGEND LABELS:
To edit labels of either of the legends used in the graph, double-click (left mouse button) the desired text to edit it.
Note: You cannot add rows (e.g., new data marks) or columns (e.g., new series of data) within the Data Editor. The number of rows and columns is set on ProVal’s Output menu, before you enter ProGraph, by your selection of valuations (or valuation sets, projections, forecasts, simulations, asset classes) and variables or years or percentiles. (If you are graphing the efficient frontier, the number of rows and columns is set by ProVal, before entering ProGraph, according to a standard format.)