The Pattern Bar lets you switch between patterns or solid colors to be used in the data series of a graph. These patterns are particularly useful when printing the graph in a black and white (B&W) printing device.
![]()
To change the patterns used in a graph, drag the desired pattern to any series of the graph.
Colored Patterns:
Please note that a colored pattern has 2 colors:
Foreground Color: the color used to draw the pattern itself.
Background Color: the color used behind the pattern.
You may change the foreground color used in any series by dragging the color from the Palette Bar and dropping it on the desired series. To change the background color, press the <shift> key while dropping the color on the desired series.
Notes:
To use Color Patterns, you must have chosen “Color Patterns”, under Color Scheme, on the General Tab of Graph Properties.
If the B&W Pattern scheme is used, the foreground color is black and the background color is white.
Customizing the Pattern Bar:
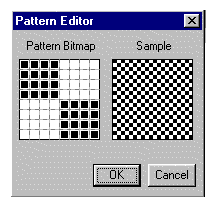
You may customize any of the patterns you wish. To change any pattern of this tool, double-click any of the patterns shown in the Pattern Bar, and the Pattern Editor dialog box will appear. This box displays the Pattern Bitmap, an enlargement of a small section of the selected pattern, and a Sample of this pattern. When you place the cursor over the pattern bitmap, it becomes a pencil. Click it on any square in the bitmap to fill the square with black ink or to remove the ink. When you have finished drawing your pattern, click on the OK button. Your custom pattern will replace the one you clicked on the pattern bar.
Note: The changes made in the Pattern Bar are not saved unless you use the Export Template command to save your settings (and the Import Template command to recall them).