QUESTION: I’d like to show a custom mix (or two) plotted against the efficient frontier. How can I do this within ProVal?
ANSWER: First create an efficient frontier, using an “optimizer”, and copy the efficient mixes onto the clipboard. Next create another efficient frontier by entering mixes directly and supplement its manual entries by pasting the efficient mixes from the clipboard. The step-by-step details are as follows:
-
Create an efficient frontier named (e.g.) “Optimized Mixes”, by selecting the “optimize asset returns” or “excess returns” option, as is appropriate. Populate the Asset Class Information topic and, for an asset return efficient frontier, the Correlations topic. Enter any minimum/maximum and/or linear constraints under the remaining two topics. Click Run, then click View, File and Save, to save the output to a spreadsheet application, such as Excel, as (e.g.) Optimized_Mix.xls.
-
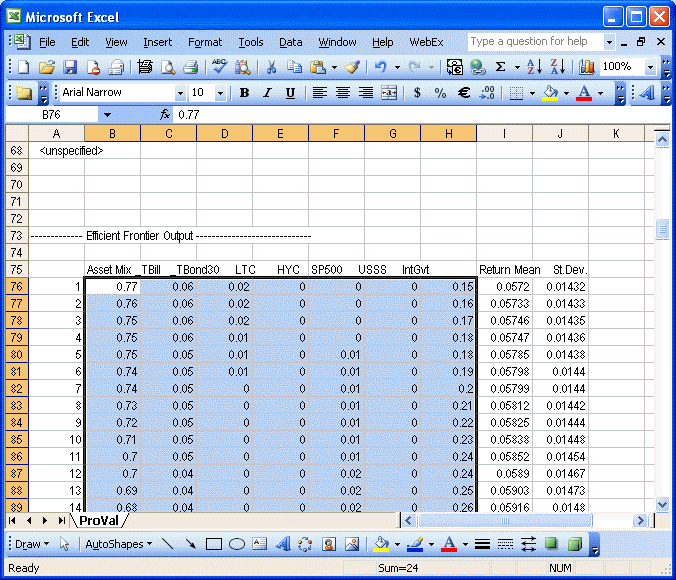
Open the new spreadsheet, Optimized_Mix.xls, and manually copy the range of mixes to a clipboard. Copy only the asset allocations, not the mix #, row headers, investment returns or standard deviations. Copy all rows, but watch out for blank columns (which sometimes get inserted when saving to Excel) and eliminate them before copying.
Sample Optimized_mix.xls and range to be copied:
-
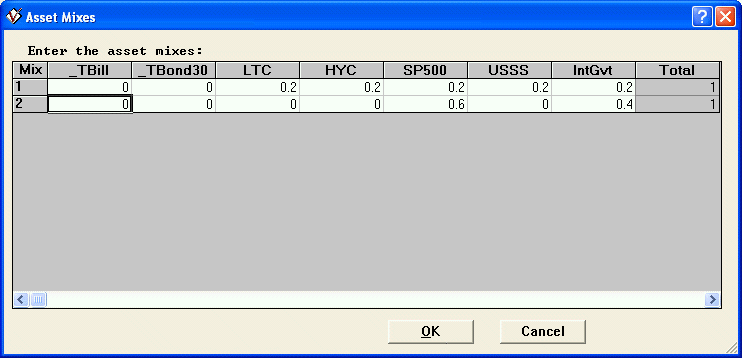
Create a second efficient frontier named (e.g.) “Custom Mix”, by selecting the “enter asset mixes” option. Complete the Asset Class Information topic and the Correlations topic via the Populate button. Be sure to reference the same Capital Market Simulation as was used for the Optimized Mixes efficient frontier. In the Custom Mix efficient frontier, enter your new mixes manually under the Efficient Frontier Mixes topic.
-
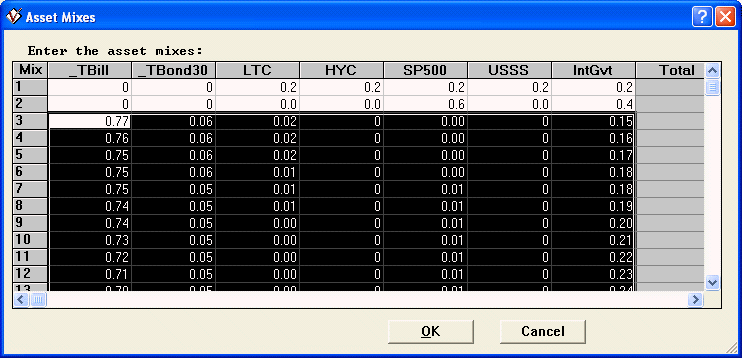
Place the cursor on any cell in the last row. Click the keyboard Enter key to add at least one new, blank, row. Paste the clipboard mixes, from the Optimized Mix efficient frontier, underneath the mixes that you had entered manually in step 3 above. To see that the copy procedure was successful, check the number of mixes you now have in the Custom Mix efficient frontier. For example, if you are comparing 100 optimized mixes to 2 that you entered manually, you should wind up with 102 mixes after you paste.
-
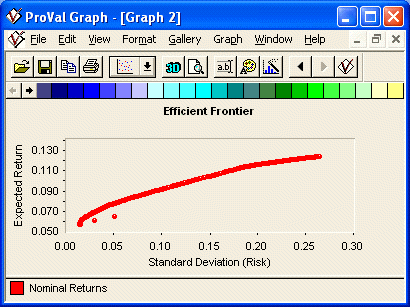
Click OK and Replace to save the revised Custom Mix efficient frontier. Reopen the Custom Mix efficient frontier, click View and Graph, to see how the manually entered mixes compare to the optimized mixes. If you want to remove the lines from the graph and see only the points, de-select the lines under Graph | Properties | Connecting Lines.


