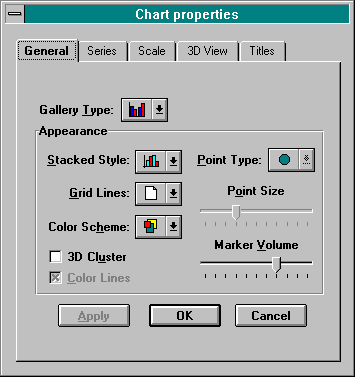
For help accessing the General Tab, see How to Set Graph Properties.
The General Tab of the Chart Properties dialog box lets you set the graph type and appearance. Select the Gallery type; then complete the Appearance section.

Gallery Type (same as Gallery menu): For changing graph types. The default setting is the (vertical) bar type.
Appearance:
This section allows you to customize general settings of the graph. Please note that the settings will apply to the entire graph (including all of its series). There are also some general settings (Point Markers, Show Values, Borders, Area Lines, Candlestick, Connecting Lines) on the Series Tab.
Stacked Style: To select the stacking style of the graph (none, stacked or 100% stacked). Only area and bar graphs can be stacked. The default setting is “none”.
Grid Lines: To select the style of grid lines in the graph (none, horizontal, vertical or both). The default setting is “none”.
Color Scheme: To select solid colors, color patterns or B&W (black and white) patterns for the series of data. The default setting is “solid” colors.
3D Cluster check: To create a 3D clustered graph. (When this box is checked, the view is three-dimensional and each series has its own row in the graph.)
Color Lines check: To make 2D lines appear in the same color as the points or marks (if shown) of the data in the series. If this box is not checked, the lines will be black. This option applies to polar, spline and line graphs. When the points are not shown (i.e., the Point Markers box on the Series Tab is not checked), this option toggles between B&W or color lines.
Point Type: To select marker shape (e.g., circle, rectangle). Only line, spline, point, scatter, pareto and polar graphs can have points. The default setting is “circle”.
Point Size slider: To select marker size for all of the series in the graph.
Marker Volume slider: To control the width of bars or the space between markers. Sliding all the way to the right will cause the bars or markers to appear together (i.e., joined).
Apply your changes without leaving the tab by pressing the Apply button. To apply your changes and return to the graph, press the OK button. To cancel changes made on this tab and return to the graph, press the Cancel button; changes already applied on other tabs will not be cancelled.