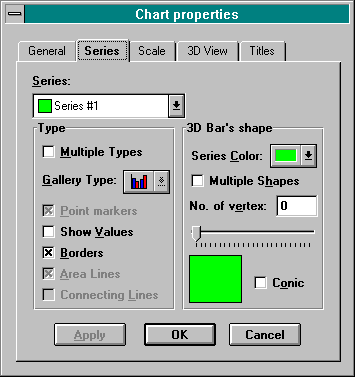
For help accessing the Series Tab, see How to Set Graph Properties.
The Series Tab of the Chart Properties dialog box lets you select settings for each series independently. There are also some general settings (Point Markers, Show Values, Borders, Area Lines, Candlestick, Connecting Lines) on this tab. After selecting the series, complete the Type and Line/Bar sections.

Series box: Allows you to select the series whose settings you want to vary from the general settings. The series legends, or labels, appear in this box. A small colored rectangle, indicating the color of the series when graphed, appears next to the label.
Type section:
Multiple Types check box: Check this box if you are graphing at least two series and want a multiple type graph. This box will be inaccessible unless the gallery type on the General Tab is one of the six types that you can combine in a multiple type graph. If you are setting one of the general parameters contained on this tab and wish to apply it to all of the series, then do not check this box.
Gallery Type: To indicate an additional gallery type when the Multiple Types box is checked. The selected gallery type will apply to the series indicated in the Series box.
Point Markers: This feature can be set either generally, or independently for a certain series. When this box is checked, ProGraph will show the data marks or points. If you have a Multi-series (i.e., two or more series) line graph and want to show points for only certain of the series, check the Multiple Types box and check the Point Markers box for the appropriate series. Do not, however, change the graph types for any of the series.
Show Values: This feature can be set either generally, or independently for a certain series. It is available for all graph types. When this box is checked, ProGraph will show the appropriate value, as text, above the data mark. If you have a Multi-series (i.e., two or more series) line graph and want to show values for only certain of the series, check the Multiple Types box and check the Show Values box for the appropriate series. Do not, however, change the graph types for any of the series.
Borders: This feature can be applied to all of the graph, or independently to a certain series. When this box is checked, borders surrounding markers (e.g., bar graph borders) are shown. As ProGraph includes borders by default, this feature is especially useful if you want to get rid of the borders of conic or cylindrical graphs.
Area Lines: When this box is checked (the default setting), the “drop down” lines of area graphs are shown.
Candlestick. This feature is applicable to hi-low graphs. When this box is checked (the default setting), the middle “open-close” section of each bar is widened, making a bar look somewhat like a candlestick.
Connecting Lines. This feature is applicable to scatter and polar graphs. If you check this box, the points of each series will be connected by a line passing through them.
Line/Bar section:
Series Color box: Select the desired color for the series indicated in the series box.
Multiple Shapes: Check this box if you want your Multi-Series (i.e., two or more series) graph to apply different conic or cylindrical shapes to the data marks of each series. Select the series and complete the remaining parameters of this section.
No. of Vertex: Type the number of sides you want the base of a conic or cylindrical graph to have, or use the slider located underneath the parameter’s box. You will see, right below the slider, a sample of the shape of the base. This option is available only for 3D graphs of the bar (vertical or horizontal), pareto, cube or hi-low type.
3D Line thick: This is the line thickness control for series in either a 3D line graph or a 3D scatter graph with connecting lines shown. Type the thickness you want, or use the slider located underneath this parameter’s box, to change the line thickness. You will see, right below the slider, a sample of the thickness that you are applying.
Conic check box: Check this box to obtain a conic, rather than cylindrical, form for a graph of the bar (vertical or horizontal), pareto, cube or hi-low type. This check box is hidden when a graph type that does not support conic graphs is selected. When any of the types that support conic graphs has been chosen, this check box will be accessible.
Note: If you have checked the Multiple Shapes box, your choice of 3D line thickness, number of vertices and conic or cylindrical shape will apply only to the particular series selected. If you have not checked the Multiple Shapes box, your choice of these three parameters will apply to all series.
Apply your changes without leaving the tab by pressing the Apply button. To apply your changes and return to the graph, press the OK button. To cancel changes made on this tab and return to the graph, press the Cancel button; changes already applied on other tabs will not be cancelled.