This type of graph, usually displayed in 3D mode, shows the relative importance of values over a period of time. This graph has several variations, including:
| 2D | 3D | |
| Simple Area: with drop down lines in each vertex. Note that the first series will block some or all of the other series.The Area Lines can be turned on or off by means of the Series Tab of Graph (or Chart) Properties. | 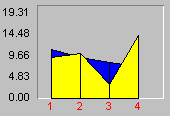 |
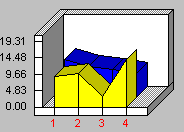 |
| Stacked Area: with drop down lines at each vertex. Each series is plotted on top of the previous one.The Stacked Style is set on the General Tab of Graph (or Chart) Properties. | 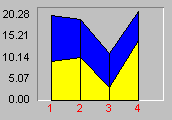 |
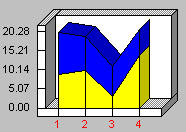 |
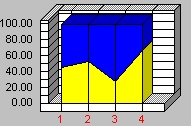
| 100% Stacked Area: with drop down lines at each vertex. Each series is plotted on top of the previous one. The height of each series in the stack is adjusted so that the stack reaches 100%, thereby demonstrating the percentage that each represents of all combined. | 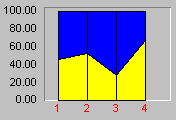 |
 |
These graphs support special 3D effects, Zoom In and rotation capabilities.