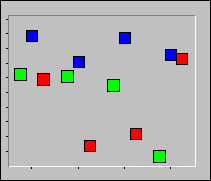
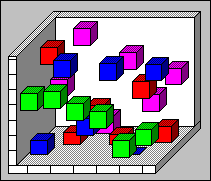
This type of graph shows the relative importance of values over a period of time. Instead of bars, cubes are the data marks. It is not commonly used in ProVal.
| 2D Cube: This type of graph is very similar to the bar graph, but, instead of a bar, a cube is displayed. You can convert this type of graph to a conic or cylindrical graph. |  |
| 3D Cube: This is the same as 2D, but displayed in 3D mode. 3D is activated on the 3D View Tab of Graph (or Chart) Properties. |  |
Please refer to Bar Graphs for other variations supported in cube graphs.
Cube Graphs support Zoom In, Special 3D effects and Rotation.