This is the most commonly used graph and shows variation over a period of time. The bars are usually drawn vertically but may be drawn horizontally. This graph has several variations, including:
| 2D | 3D | |
| Simple Column Graph: The data marks are shown as columns, with a space between each series (grouping) of data marks. |  |
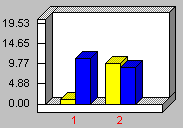 |
| Stacked: Each column is positioned above the previous one, adding its value to the stacked bar.The Stacked Style is set on the General Tab of Graph (or Chart) Properties. | 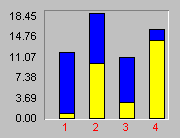 |
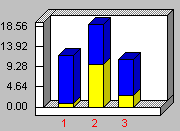 |
| 100% Stacked: Each column is positioned above the previous one, adding its value to the stacked bar. The height of each column in the stack is adjusted so that the stack reaches 100%, thereby demonstrating the percentage that each represents of all combined.The Stacked Style is set on the General Tab. | 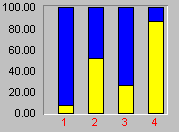 |
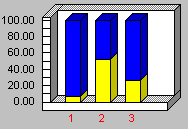 |
| Joined Bars: This is the same as the simple column graph, but there are no spaces between the series.The Marker Volume option, on the General Tab, sets the width of the bars. Setting the Marker Volume at 100% will join all series together. | 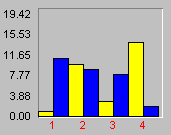 |
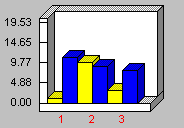 |
| Show Zero: This type of graph is used when you have negative (less than zero) values on the graph. The starting point of all bars is zero. Therefore, you will have bars that go up and bars that go down (depending upon their value). The Show Zero Axis option is set on the Scale Tab of Graph (or Chart) Properties. | 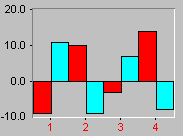 |
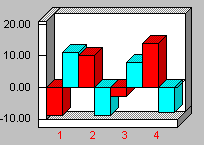 |
| 3D Clustered Bars: Each bar will be drawn as a three-dimensional figure and each series will have its own row in the graph.The 3D Cluster option is set on the General Tab.3D is activated, however, on the 3D View Tab of Graph (or Chart) Properties.Note: Clustering works only if you have the 3D view turned on. | n/a | 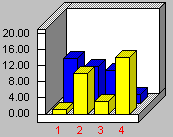 |
| 3D Clustered/Joined Bars: This is the same as 3D clustered bars except that the series are drawn together, with no spaces between the series. This is accomplished by setting the Marker Volume, on the General Tab, at 100%, to join all series together. | n/a | 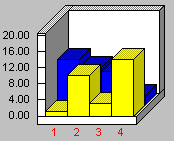 |
NOTE: For all the graphs shown above, there is another important variation, drawing all the bars HORIZONTALLY, for example:
Horizontal Bar Graphs Samples:
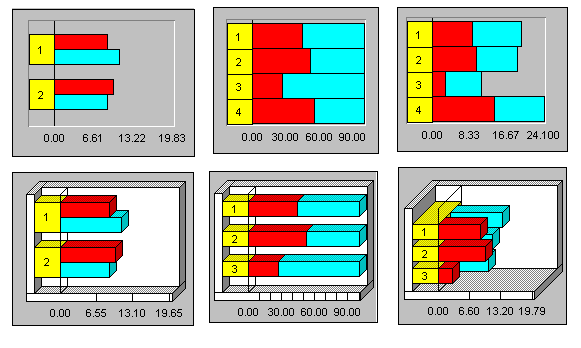
These graphs support special 3D effects, Zoom In and rotation capabilities.