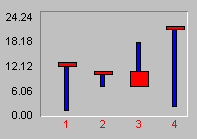
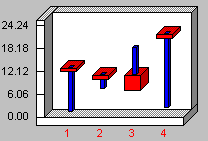
This graph is used in financial studies, although not commonly in ProVal. It shows columns containing three or four series, representing stock volumes related to open, high, low, and closing prices, respectively. If you have only three series, they will be graphed as Low-Close-High. If you have four series, they will be graphed as Low-Open-Close-High. Important! Your data series must be in this order.
Examples of financial graphs include:
| 2D Candlestick: This example contains four series and shows stock volumes related to open, high, low and closing prices.The Candlestick option can be turned on or off by means of the Series Tab of Graph (or Chart) Properties. |  |
| 3D Candlestick: This is the same as 2D candlestick, but the graph is three-dimensional.3D is activated on the 3D View Tab of Graph (or Chart) Properties. |  |
Please note that these variations also apply to Low-Close-High.
These graphs support special 3D effects, Zoom In and rotation capabilities.