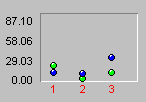
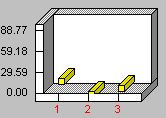
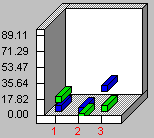
This type of graph is similar to the line graph but plots only the points or data marks. This graph has several variations, including:
| Points: Points can be displayed in several forms, including rectangles, circles, triangles, marbles and cubes.The Point Markers can be turned on or off by means of the Series Tab of Graph (or Chart) Properties.The Point Type (e.g., circle, rectangle) and Point Size are set on the General Tab of Graph (or Chart) Properties. |  |
| 3D Points: Each point will be drawn as a three-dimensional figure.The Point Type must be set to <cube>on the General Tab. |  |
| 3D Clustered Points: Each point will be drawn as a three-dimensional figure and its series will have its own row.The Point Type must be set to <cube>on the General Tab.The 3D Cluster option is set on the General Tab. |  |
| 3D is activated, however, on the 3D View Tab of Graph (or Chart) Properties. Note: clustering works only if you have the 3D view turned on. |
These graphs support special 3D effects, Zoom In and rotation capabilities.