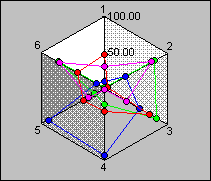
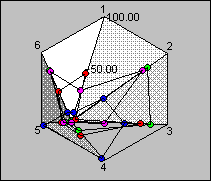
This type of graph shows the relative importance of values over a period of time. It is not commonly used in ProVal.
| 2D Polar: Points can be displayed in several forms, including rectangles, circles, triangles, marbles and cubes. The points, or data marks, may be turned off. Connecting lines may be shown in addition to, or in place of, points.The Point Markers can be turned on or off by means of the Series Tab of Graph (or Chart) Properties.The Point Type (e.g., circle, rectangle) and Point Size are set on the General Tab of Graph (or Chart) Properties.The Connecting Lines option can be turned on or off by means of the Series Tab. |  |
| 3D Polar: This is the same as 2D polar, but displayed in 3D mode.3D is activated on the 3D View Tab of Graph (or Chart) Properties. |  |
3D Polar graphs support Special 3D effects, Zoom In, and rotation capabilities.